
Page 164 - Revised Maths Wisdom Class - 6
P. 164
162 MATHS
4. The marks of a student in different subjects are given below:
Subjects French English Maths Science Social Science
Marks 43 56 80 65 50
Draw a bar graph from the above information.
5. The following table shows the favourite games of 250 students of a school.
Games Swimming Badminton Football Tennis Cricket
No. of students 75 35 50 25 65
Represent the above data by a bar graph.
6. The following table shows the number of scooters produced by a company during six consecutive years.
Years 2001 2002 2003 2004 2005 2006
No. of Scooters 11000 14000 12500 17500 15000 24000
Draw a bar graph to represent the above data.
7. The following data shows India’s total population (in millions) from 1951 to 2001.
Years of Census 1951 1961 1971 1981 1991 2001
Population (in millions) 360 432 542 684 850 1020
Represent the above data by a bar graph.
8. The following table shows the life expectancy (average age to which people live) in various countries in a
particular year.
Countries Japan India Britain Ethiopia Cambodia
Life expectancy (in years) 76 57 70 43 36
Represent the above data by a bar graph.
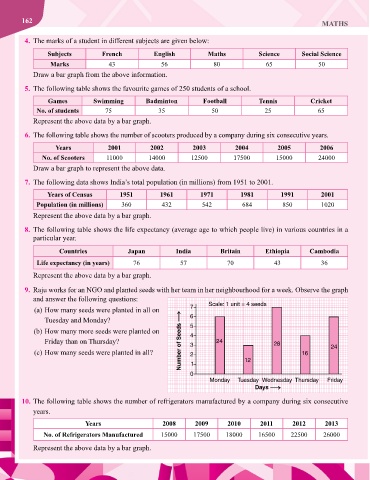
9. Raju works for an NGO and planted seeds with her team in her neighbourhood for a week. Observe the graph
and answer the following questions:
(a) How many seeds were planted in all on
Tuesday and Monday?
(b) How many more seeds were planted on
Friday than on Thursday?
(c) How many seeds were planted in all?
10. The following table shows the number of refrigerators manufactured by a company during six consecutive
years.
Years 2008 2009 2010 2011 2012 2013
No. of Refrigerators Manufactured 15000 17500 18000 16500 22500 26000
Represent the above data by a bar graph.