
Page 160 - Revised Maths Wisdom Class - 6
P. 160
158 MATHS
ILLUSTRATIONS
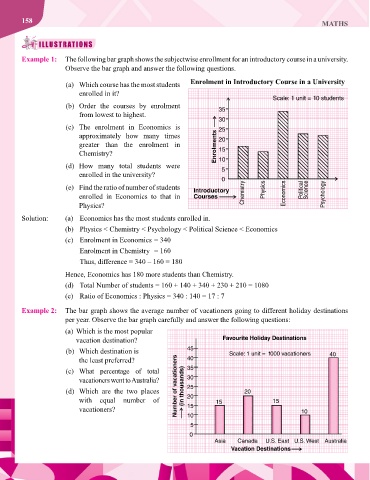
Example 1: The following bar graph shows the subjectwise enrollment for an introductory course in a university.
Observe the bar graph and answer the following questions.
(a) Which course has the most students Enrolment in Introductory Course in a University
enrolled in it?
(b) Order the courses by enrolment
from lowest to highest.
(c) The enrolment in Economics is
approximately how many times
greater than the enrolment in Enrolments
Chemistry?
(d) How many total students were
enrolled in the university?
(e) Find the ratio of number of students
enrolled in Economics to that in
Physics?
Solution: (a) Economics has the most students enrolled in.
(b) Physics < Chemistry < Psychology < Political Science < Economics
(c) Enrolment in Economics = 340
Enrolment in Chemistry = 160
Thus, difference = 340 – 160 = 180
Hence, Economics has 180 more students than Chemistry.
(d) Total Number of students = 160 + 140 + 340 + 230 + 210 = 1080
(e) Ratio of Economics : Physics = 340 : 140 = 17 : 7
Example 2: The bar graph shows the average number of vacationers going to different holiday destinations
per year. Observe the bar graph carefully and answer the following questions:
(a) Which is the most popular
vacation destination?
(b) Which destination is
the least preferred?
(c) What percentage of total
vacationers went to Australia?
(d) Which are the two places
with equal number of
vacationers?