
Page 159 - Revised Maths Wisdom Class - 6
P. 159
Data Handling and Presentation 157
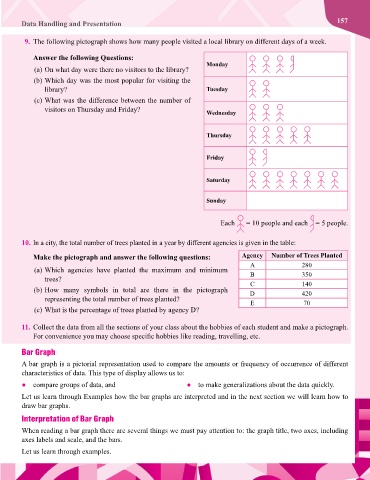
9. The following pictograph shows how many people visited a local library on different days of a week.
Answer the following Questions:
Monday
(a) On what day were there no visitors to the library?
(b) Which day was the most popular for visiting the
library? Tuesday
(c) What was the difference between the number of
visitors on Thursday and Friday? Wednesday
Thursday
Friday
Saturday
Sunday
Each = 10 people and each = 5 people.
10. In a city, the total number of trees planted in a year by different agencies is given in the table:
Make the pictograph and answer the following questions: Agency Number of Trees Planted
A 280
(a) Which agencies have planted the maximum and minimum
trees? B 350
(b) How many symbols in total are there in the pictograph C 140
420
D
representing the total number of trees planted? E 70
(c) What is the percentage of trees planted by agency D?
11. Collect the data from all the sections of your class about the hobbies of each student and make a pictograph.
For convenience you may choose specific hobbies like reading, travelling, etc.
Bar Graph
A bar graph is a pictorial representation used to compare the amounts or frequency of occurrence of different
characteristics of data. This type of display allows us to:
● compare groups of data, and ● to make generalizations about the data quickly.
Let us learn through Examples how the bar graphs are interpreted and in the next section we will learn how to
draw bar graphs.
Interpretation of Bar Graph
When reading a bar graph there are several things we must pay attention to: the graph title, two axes, including
axes labels and scale, and the bars.
Let us learn through examples.