
Page 161 - Revised Maths Wisdom Class - 6
P. 161
Data Handling and Presentation 159
Solution: (a) Australia is the most preferred destination. (b) U.S. West is the least preferred destination.
(c) Total number of vacationers = 15000 + 20000 + 15000 + 10000 + 40000 = 100000
Number of Vacationers visiting Australia = 40000
Hence, Required Percentage = (40000/100000) × 100 = 40%
(d) Asia and U.S. East have equal number of vacationers, i.e., 15000
Drawing a bar graph
To draw a bar graph, we follow these steps:
Step 1: On a graph paper, we draw horizontal line (x-axis) and a vertical line (y-axis).
Step 2: Mark points at equal intervals along horizontal line. Below these points write the names of the data items
whose values are to be plotted.
Step 3: Choose a suitable scale. On that scale determine the height of the bars for the numerical values.
Step 4: Mark these heights parallel to the y-axis from the points taken in step 2.
Step 5: On the horizontal line, draw bars of equal width for the heights marked in step 4.
Let us learn through examples.
ILLUSTRATIONS
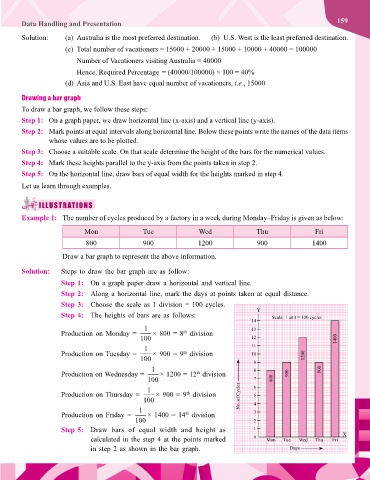
Example 1: The number of cycles produced by a factory in a week during Monday–Friday is given as below:
Mon Tue Wed Thu Fri
800 900 1200 900 1400
Draw a bar graph to represent the above information.
Solution: Steps to draw the bar graph are as follow:
Step 1: On a graph paper draw a horizontal and vertical line.
Step 2: Along a horizontal line, mark the days at points taken at equal distance.
Step 3: Choose the scale as 1 division = 100 cycles.
Y
Step 4: The heights of bars are as follows: Scale: 1 unit = 100 cycles
14
1 13
Production on Monday = × 800 = 8 division
th
100 12 1400
1 11
Production on Tuesday = × 900 = 9 division 10
th
100 9 1200
1 8 900
Production on Wednesday = × 1200 = 12 division 900
th
100 7 800
1 6
Production on Thursday = × 900 = 9 division No. of Cycles 5
th
100 4
1
Production on Friday = × 1400 = 14 division 3
th
100 2
Step 5: Draw bars of equal width and height as 1
calculated in the step 4 at the points marked 0 Mon Tue Wed Thu Fri X
in step 2 as shown in the bar graph. Days