
Page 166 - Revised Maths Wisdom Class - 6
P. 166
164 MATHS
5. Each numerical figure of data is called:
(a) frequency (b) observation (c) array (d) range
6. The width of all the rectangle in the bar graph is always:
(a) half (b) equal (c) double (d) unequal
7. The rectangles of a bar graph are placed at:
(a) equal distance (b) unequal distance (c) no distance (d) none of these
8. Frequency of 2 in data 5, 2, 7, 3, 2, 4, 2, 1 is:
(a) 0 (b) 1 (c) 2 (d) 3
9. During organization of data, tally marks are used to find the:
(a) frequency (b) cumulative frequency (c) class limit (d) variable
10. Mention of scale is important in:
(a) bar graph (b) pictograph (c) multiple bar charts (d) all of these
C Fill in the Blanks Fill in the Blanks
1. An information in the form of numerical figures is called _________.
2. If represents 5 books, then represents _________ books.
3. Data in its original form is called _________ data.
4. The width of the bar in a bar graph remains the _________ for all bars.
D Write ‘t’ FOr true and ‘F’ FOr False stateMents Write ‘t’ FOr true and ‘F’ FOr False stateMents
1. Each numerical figure of data is called the range of data.
2. The rectangles of a bar graph are placed at equal distance.
3. Frequency of 2 in data 5, 2, 7, 3, 2, 4, 2, 1 is 3.
4. During organisation of data, tally marks are used to find the class limit.
5. Mention of scale is important in bar graph.
E Case study Based QuestiOns Case study Based QuestiOns
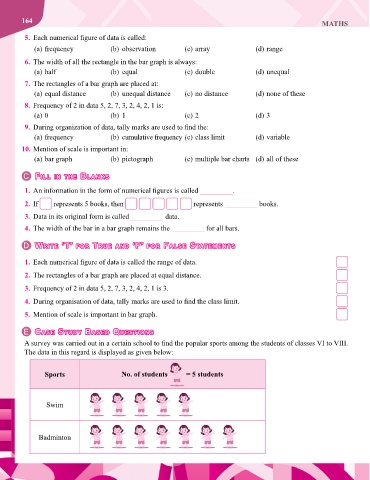
A survey was carried out in a certain school to find the popular sports among the students of classes VI to VIII.
The data in this regard is displayed as given below:
Sports No. of students = 5 students
Swim
Badminton