
Page 168 - Revised Maths Wisdom Class - 6
P. 168
166 MATHS
SUBJECTIVE TYPE QUESTIONS
G sOlve the FOllOWing QuestiOns sOlve the FOllOWing QuestiOns
1. How bar graphs are different from pictographs. Explain with an example.
2. Number of people in various age groups in a city is given in the following table:
Age group 10-20 20-30 30-40 40-50 50-60 60-70
2 lakh 1 lakh 1 lakh 1 lakh
No. of people 70 thousand 30 thousand
60 thousand 80 thousand 50 thousand 60 thousand
Draw a bar graph to represent the above information and answer the following questions:
(a) Which age group has the highest population?
(b) How many senior citizens are there in city?
3. In a ready-made garments store, the following sizes of shirts were sold in a particular day:
38, 36, 34, 32, 42, 36, 38, 42, 44, 44, 40, 38, 38, 36, 32, 40, 40, 34, 34, 42, 44, 32, 38, 36, 42, 40, 44, 36, 44, 32.
Prepare a table using tally marks and find the shirt size having the maximum sale.
INTEGRATED QUESTION (SOCIAL SCIENCE/MATHS)
INTEGRATED QUESTION (SOCIAL SCIENCE/MATHS)
The table given below shows average monthly rainfall of Mumbai and Lucknow.
Months Lucknow (inches) Mumbai (inches)
January 0.6 0.0
February 0.8 0.1
March 0.5 0.1
April 0.6 0.1
May 1.0 1.8
June 2.8 15.8
July 6.3 23.4
August 6.7 16.8
September 3.9 10.6
October 0.6 3.3
November 0.1 0.4
December 0.3 0.1
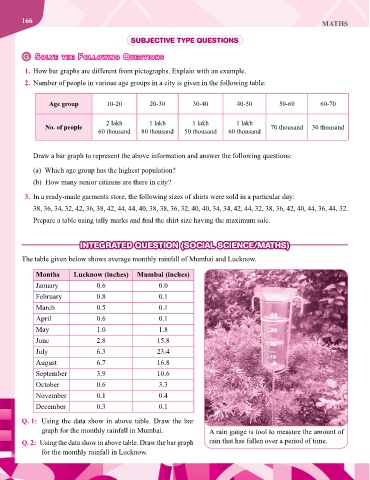
Q. 1: Using the data show in above table. Draw the bar
graph for the monthly rainfall in Mumbai. A rain gauge is tool to measure the amount of
Q. 2: Using the data show in above table. Draw the bar graph rain that has fallen over a period of time.
for the monthly rainfall in Lucknow.