
Page 170 - Revised Maths Wisdom Class - 6
P. 170
168 MATHS
COGNITIVE
MAP
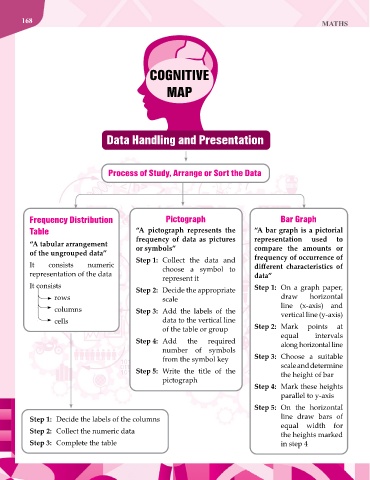
Data Handling and Presentation
Process of Study, Arrange or Sort the Data
Frequency Distribution Pictograph Bar Graph
Table “A pictograph represents the “A bar graph is a pictorial
“A tabular arrangement frequency of data as pictures representation used to
compare the amounts or
or symbols”
of the ungrouped data” frequency of occurrence of
It consists numeric Step 1: Collect the data and different characteristics of
representation of the data choose a symbol to data”
represent it
It consists Step 2: Decide the appropriate Step 1: On a graph paper,
rows scale draw horizontal
columns Step 3: Add the labels of the line (x-axis) and
vertical line (y-axis)
cells data to the vertical line
of the table or group Step 2: Mark points at
Step 4: Add the required equal intervals
along horizontal line
number of symbols
from the symbol key Step 3: Choose a suitable
Step 5: Write the title of the scale and determine
the height of bar
pictograph
Step 4: Mark these heights
parallel to y-axis
Step 5: On the horizontal
Step 1: Decide the labels of the columns line draw bars of
Step 2: Collect the numeric data equal width for
the heights marked
Step 3: Complete the table in step 4