
Page 163 - Revised Maths Wisdom Class - 6
P. 163
Data Handling and Presentation 161
Exercise 10C
Exercise 10C
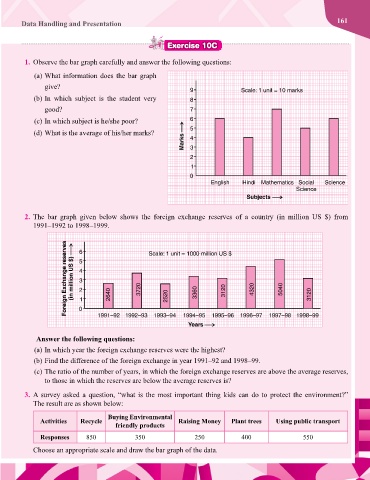
1. Observe the bar graph carefully and answer the following questions:
(a) What information does the bar graph
give?
(b) In which subject is the student very
good?
(c) In which subject is he/she poor?
(d) What is the average of his/her marks?
2. The bar graph given below shows the foreign exchange reserves of a country (in million US $) from
1991–1992 to 1998–1999.
Answer the following questions:
(a) In which year the foreign exchange reserves were the highest?
(b) Find the difference of the foreign exchange in year 1991–92 and 1998–99.
(c) The ratio of the number of years, in which the foreign exchange reserves are above the average reserves,
to those in which the reserves are below the average reserves is?
3. A survey asked a question, “what is the most important thing kids can do to protect the environment?”
The result are as shown below:
Buying Environmental
Activities Recycle Raising Money Plant trees Using public transport
friendly products
Responses 850 350 250 400 550
Choose an appropriate scale and draw the bar graph of the data.