
Page 162 - Revised Maths Wisdom Class - 6
P. 162
160 MATHS
Example 2: The following are the number of students admitted in a school in different classes:
Classes VI VII VIII IX X XI XII
No. of Students 50 64 74 84 60 80 84
Draw the bar graph to represent the above information.
Solution: Step 1: On a graph paper, draw a horizontal line as x-axis and a vertical line as y-axis.
Step 2: Mark points at equal intervals 45 Scale: 1 unit = 2 Students
along horizontal line (x-axis). 40
Below these points write the class 35
whose value is to be plotted. 30
Step 3: Choose a suitable scale. Let the 25
scale be 1 unit = 2 students. 20
15
Step 4: The heights of the bars are as 10
follows. 5
0
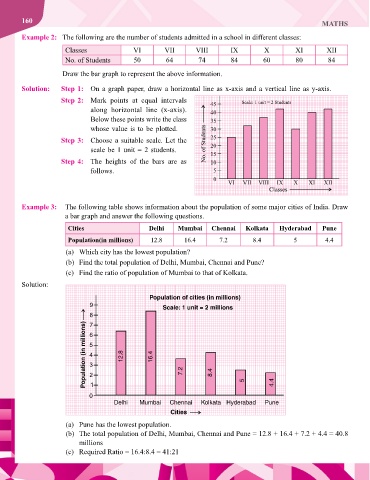
Example 3: The following table shows information about the population of some major cities of India. Draw
a bar graph and answer the following questions.
Cities Delhi Mumbai Chennai Kolkata Hyderabad Pune
Population(in millions) 12.8 16.4 7.2 8.4 5 4.4
(a) Which city has the lowest population?
(b) Find the total population of Delhi, Mumbai, Chennai and Pune?
(c) Find the ratio of population of Mumbai to that of Kolkata.
Solution:
9
8
7
6
5
4
3
2
1
(a) Pune has the lowest population.
(b) The total population of Delhi, Mumbai, Chennai and Pune = 12.8 + 16.4 + 7.2 + 4.4 = 40.8
millions
(c) Required Ratio = 16.4:8.4 = 41:21