
Page 235 - Ai Book - 10
P. 235
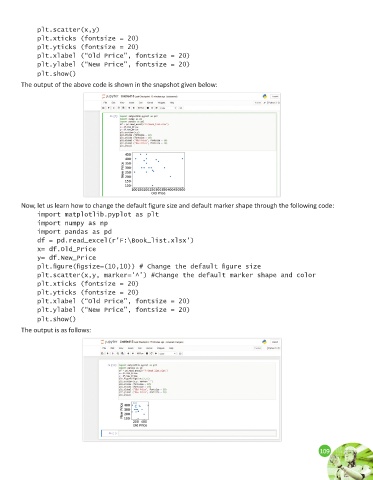
plt.scatter(x,y)
              plt.xticks (fontsize = 20)
              plt.yticks (fontsize = 20)
              plt.xlabel (“Old Price”, fontsize = 20)
              plt.ylabel (“New Price”, fontsize = 20)
              plt.show()
        The output of the above code is shown in the snapshot given below:


        Now, let us learn how to change the default figure size and default marker shape through the following code:

              import matplotlib.pyplot as plt
              import numpy as np
              import pandas as pd
              df = pd.read_excel(r’F:\Book_list.xlsx’)
              x= df.Old_Price
              y= df.New_Price
              plt.figure(figsize=(10,10)) # Change the default figure size
              plt.scatter(x,y, marker=’^’) #Change the default marker shape and color
              plt.xticks (fontsize = 20)
              plt.yticks (fontsize = 20)
              plt.xlabel (“Old Price”, fontsize = 20)
              plt.ylabel (“New Price”, fontsize = 20)
              plt.show()
        The output is as follows:


                                                                                                             109
                                                                                                             109