
Page 230 - Ai Book - 10
P. 230
To calculate mode in Python:
import statistics
num = [10,20,30,40,50,60,60,70,70,70,80]
m = statistics.mode(num)
print(“The most frequent number is:”, m)
Output:
The most frequent number is: 70
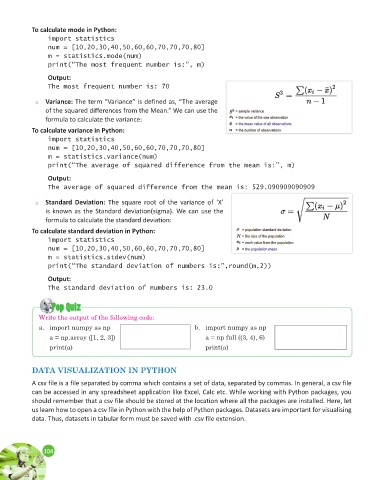
u Variance: The term “Variance” is defined as, “The average
of the squared differences from the Mean.” We can use the
formula to calculate the variance:
To calculate variance in Python:
import statistics
num = [10,20,30,40,50,60,60,70,70,70,80]
m = statistics.variance(num)
print(“The average of squared difference from the mean is:”, m)
Output:
The average of squared difference from the mean is: 529.090909090909
u Standard Deviation: The square root of the variance of ‘X’
is known as the Standard deviation(sigma). We can use the
formula to calculate the standard deviation:
To calculate standard deviation in Python:
import statistics
num = [10,20,30,40,50,60,60,70,70,70,80]
m = statistics.stdev(num)
print(“The standard deviation of numbers is:”,round(m,2))
Output:
The standard deviation of numbers is: 23.0
Pop Quiz Quiz
Pop
Write the output of the following code:
a. import numpy as np b. import numpy as np
a = np.array ([1, 2, 3]) a = np full ((3, 4), 6)
print(a) print(a)
DATA VISUALIZATION IN PYTHON
A csv file is a file separated by comma which contains a set of data, separated by commas. In general, a csv file
can be accessed in any spreadsheet application like Excel, Calc etc. While working with Python packages, you
should remember that a csv file should be stored at the location where all the packages are installed. Here, let
us learn how to open a csv file in Python with the help of Python packages. Datasets are important for visualising
data. Thus, datasets in tabular form must be saved with .csv file extension.
104
104