
Page 234 - Ai Book - 10
P. 234
The output of the above code is shown in the snapshot given below:
After labeling axes, let us learn how to add a title in Scatter Plot using title() function. To add a title in the above
scatter plot, you should write the following lines of code:
import matplotlib.pyplot as plt
import numpy as np
df = pd.read_excel(r’F:\Book_list.xlsx’)
x= df.Old_Price
y= df.New_Price
plt.scatter(x,y)
plt.xticks (rotation=90)
plt.yticks (rotation=90)
plt.xlabel (“Old Price”, fontsize = 10)
plt.ylabel (“New Price”, fontsize = 10)
plt.title (“Book list with different Prices”, fontsize = 14)
plt.show()
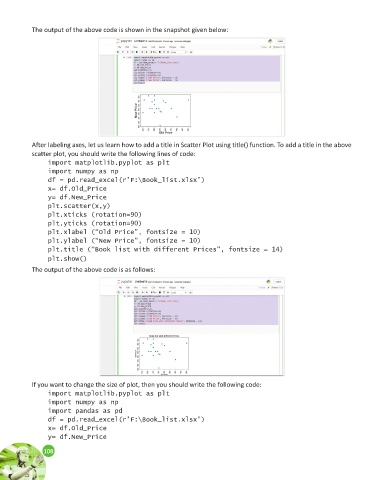
The output of the above code is as follows:
If you want to change the size of plot, then you should write the following code:
import matplotlib.pyplot as plt
import numpy as np
import pandas as pd
df = pd.read_excel(r’F:\Book_list.xlsx’)
x= df.Old_Price
y= df.New_Price
108
108