
Page 163 - Computer - 9(A&B)
P. 163
While working on the lesson, you can keep the track of time remaining to complete that lesson in the toolbar
area. If you want to note the total time you took to complete the lesson, change its option to elapsed time in the
lesson time drop button on the toolbar.
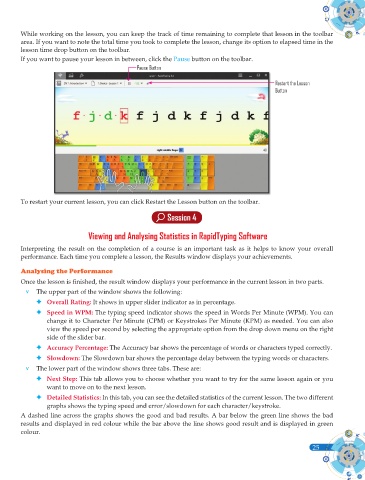
If you want to pause your lesson in between, click the Pause button on the toolbar.
Pause Button
Restart the Lesson
Button
To restart your current lesson, you can click Restart the Lesson button on the toolbar.
Session 4
Viewing and Analysing Statistics in RapidTyping Software
Interpreting the result on the completion of a course is an important task as it helps to know your overall
performance. Each time you complete a lesson, the Results window displays your achievements.
Analysing the Performance
Once the lesson is fi nished, the result window displays your performance in the current lesson in two parts.
v The upper part of the window shows the following:
Overall Rating: It shows in upper slider indicator as in percentage.
Speed in WPM: The typing speed indicator shows the speed in Words Per Minute (WPM). You can
change it to Character Per Minute (CPM) or Keystrokes Per Minute (KPM) as needed. You can also
view the speed per second by selecting the appropriate option from the drop down menu on the right
side of the slider bar.
Accuracy Percentage: The Accuracy bar shows the percentage of words or characters typed correctly.
Slowdown: The Slowdown bar shows the percentage delay between the typing words or characters.
v The lower part of the window shows three tabs. These are:
Next Step: This tab allows you to choose whether you want to try for the same lesson again or you
want to move on to the next lesson.
Detailed Statistics: In this tab, you can see the detailed statistics of the current lesson. The two different
graphs shows the typing speed and error/slowdown for each character/keystroke.
A dashed line across the graphs shows the good and bad results. A bar below the green line shows the bad
results and displayed in red colour while the bar above the line shows good result and is displayed in green
colour.
25