
Page 241 - Ai Book - 10
P. 241
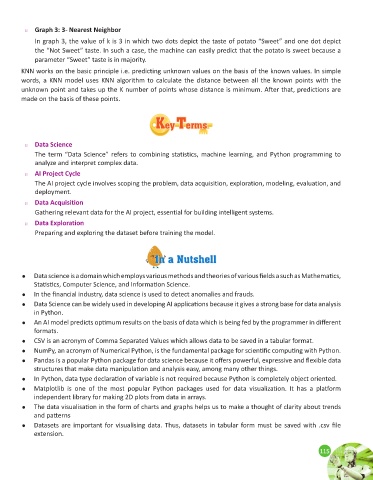
u   Graph 3: 3- Nearest Neighbor
             In graph 3, the value of k is 3 in which two dots depict the taste of potato “Sweet” and one dot depict
             the “Not Sweet” taste. In such a case, the machine can easily predict that the potato is sweet because a
             parameter “Sweet” taste is in majority.
        KNN works on the basic principle i.e. predicting unknown values on the basis of the known values. In simple
        words, a KNN model uses KNN algorithm to calculate the distance between all the known points with the
        unknown point and takes up the K number of points whose distance is minimum. After that, predictions are
        made on the basis of these points.


                                                      K Keyey  TTermserms


         u   Data Science
             The term “Data Science” refers to combining statistics, machine learning, and Python programming to
             analyze and interpret complex data.

         u   AI Project Cycle
             The AI project cycle involves scoping the problem, data acquisition, exploration, modeling, evaluation, and
             deployment.

         u   Data Acquisition
             Gathering relevant data for the AI project, essential for building intelligent systems.
         u   Data Exploration
             Preparing and exploring the dataset before training the model.


                                                     In a NutshellIn a Nutshell


            •  Data science is a domain which employs various methods and theories of various fields a such as Mathematics,
             Statistics, Computer Science, and Information Science.
            •  In the financial industry, data science is used to detect anomalies and frauds.
            •  Data Science can be widely used in developing AI applications because it gives a strong base for data analysis
             in Python.
            •  An AI model predicts optimum results on the basis of data which is being fed by the programmer in different
             formats.
            •  CSV is an acronym of Comma Separated Values which allows data to be saved in a tabular format.
            •  NumPy, an acronym of Numerical Python, is the fundamental package for scientific computing with Python.
            •  Pandas is a popular Python package for data science because it offers powerful, expressive and flexible data
             structures that make data manipulation and analysis easy, among many other things.
            •  In Python, data type declaration of variable is not required because Python is completely object oriented.
            •  Matplotlib  is  one  of  the  most  popular  Python  packages  used  for  data  visualization.  It  has  a  platform
             independent library for making 2D plots from data in arrays.
            •  The data visualisation in the form of charts and graphs helps us to make a thought of clarity about trends
             and patterns

            •  Datasets are important for visualising data. Thus, datasets in tabular form must be saved with .csv file
             extension.


                                                                                                             115
                                                                                                             115