
Page 156 - Computer - 7
P. 156
P P RR OO JJ EE CC TT S S
A. Excel 2019
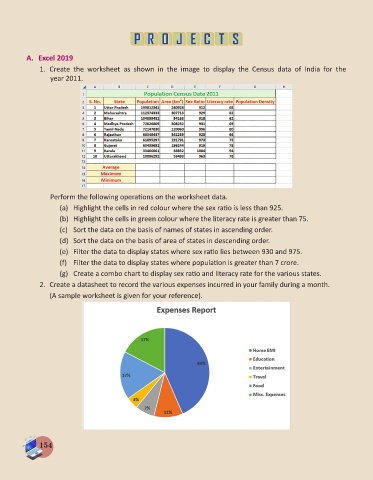
1. Create the worksheet as shown in the image to display the Census data of India for the
year 2011.
Perform the following operations on the worksheet data.
(a) Highlight the cells in red colour where the sex ratio is less than 925.
(b) Highlight the cells in green colour where the literacy rate is greater than 75.
(c) Sort the data on the basis of names of states in ascending order.
(d) Sort the data on the basis of area of states in descending order.
(e) Filter the data to display states where sex ratio lies between 930 and 975.
(f) Filter the data to display states where population is greater than 7 crore.
(g) Create a combo chart to display sex ratio and literacy rate for the various states.
2. Create a datasheet to record the various expenses incurred in your family during a month.
(A sample worksheet is given for your reference).
154