Page 152 - Revised Maths Wisdom Class - 6
P. 152

150                                                                                                 MATHS


            ● A  tabular  arrangement  of  the  ungrouped  data  showing  the  frequency  of  each  item  is  called  frequency
            distribution and the table is called the frequency distribution table.


        Making Frequency Distribution Table
        To make frequency distribution table, we follow these steps:

        Step 1:  Collect the raw data and array it.
        Step 2:  Make three columns—first for observation, second for tally marks and third for total of tally marks
                  showing the frequency of each observation.
        Step 3:  For each observation in the raw data, put a bar in the second column. Record these tally marks in groups
                  of five with the fifth bar crossing the other four diagonally (  ).
        Step 4:  Count the tally marks for each observation and write in the third column.

        Let us learn through examples.

              ILLUSTRATIONS

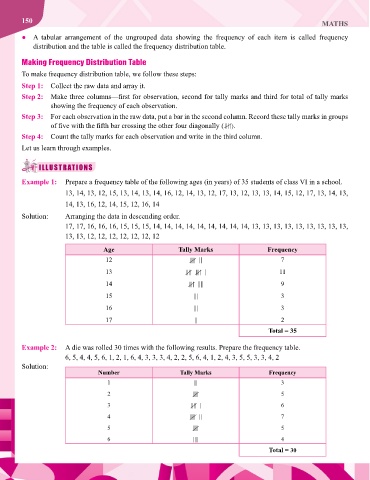
        Example 1:  Prepare a frequency table of the following ages (in years) of 35 students of class VI in a school.

                       13, 14, 13, 12, 15, 13, 14, 13, 14, 16, 12, 14, 13, 12, 17, 13, 12, 13, 13, 14, 15, 12, 17, 13, 14, 13,
                       14, 13, 16, 12, 14, 15, 12, 16, 14

        Solution:      Arranging the data in descending order.
                       17, 17, 16, 16, 16, 15, 15, 15, 14, 14, 14, 14, 14, 14, 14, 14, 14, 13, 13, 13, 13, 13, 13, 13, 13, 13,
                       13, 13, 12, 12, 12, 12, 12, 12, 12
                                   Age                      Tally Marks                   Frequency

                                    12                              ||                        7
                                    13                                |                      11

                                    14                             ||||                       9
                                    15                           |||                          3

                                    16                           |||                          3
                                    17                           ||                           2
                                                                                          Total = 35


        Example 2:  A die was rolled 30 times with the following results. Prepare the frequency table.
                       6, 5, 4, 4, 5, 6, 1, 2, 1, 6, 4, 3, 3, 3, 4, 2, 2, 5, 6, 4, 1, 2, 4, 3, 5, 5, 3, 3, 4, 2
        Solution:
                                  Number                     Tally Marks                  Frequency
                                     1                           |||                          3
                                     2                                                        5

                                     3                              |                         6
                                     4                              ||                        7
                                     5                                                        5

                                     6                           ||||                         4
                                                                                          Total = 30
   147   148   149   150   151   152   153   154   155   156   157