
Page 285 - Computer - 9(A&B)
P. 285
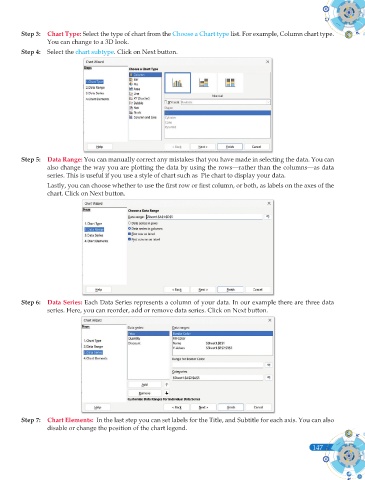
Step 3:  Chart Type: Select the type of chart from the Choose a Chart type list. For example, Column chart type.
                 You can change to a 3D look.
        Step 4:  Select the chart subtype. Click on Next button.


        Step 5:  Data Range: You can manually correct any mistakes that you have made in selecting the data. You can
                 also change the way you are plotting the data by using the rows—rather than the columns—as data
                 series. This is useful if you use a style of chart such as  Pie chart to display your data.
                 Lastly, you can choose whether to use the fi rst row or fi rst column, or both, as labels on the axes of the
                 chart. Click on Next button.


        Step 6:  Data Series: Each Data Series represents a column of your data. In our example there are three data
                 series. Here, you can reorder, add or remove data series. Click on Next button.


        Step 7:  Chart Elements:  In the last step you can set labels for the Title, and Subtitle for each axis. You can also
                 disable or change the position of the chart legend.


                                                                                                             147
                                                                                                             147