
Page 284 - Computer - 9(A&B)
P. 284
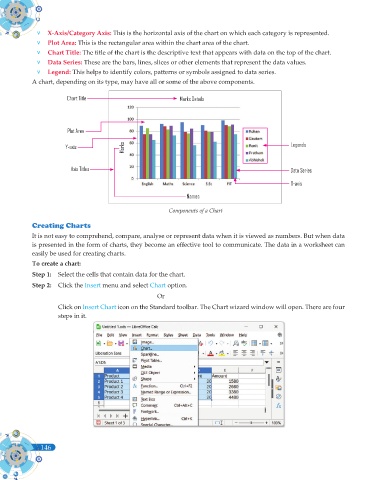
v X-Axis/Category Axis: This is the horizontal axis of the chart on which each category is represented.
              v Plot Area: This is the rectangular area within the chart area of the chart.
              v Chart Title: The title of the chart is the descriptive text that appears with data on the top of the chart.

              v Data Series: These are the bars, lines, slices or other elements that represent the data values.
              v Legend: This helps to identify colors, patterns or symbols assigned to data series.
            A chart, depending on its type, may have all or some of the above components.

                        Chart Title                            Marks Details


                        Plot Area

                        Y-axis              Marks                                                     Legends


                          Axis Titles                                                                Data Series

                                                                                                     X-axis

                                                                 Names

                                                           Components of a Chart

            Creating Charts
            It is not easy to comprehend, compare, analyse or represent data when it is viewed as numbers. But when data
            is presented in the form of charts, they become an effective tool to communicate. The data in a worksheet can
            easily be used for creating charts.
            To create a chart:
            Step 1:  Select the cells that contain data for the chart.

            Step 2:  Click the Insert menu and select Chart option.
                                                       Or
                     Click on Insert Chart icon on the Standard toolbar. The Chart wizard window will open. There are four
                     steps in it.


               146
               146