
Page 290 - Computer - 9(A&B)
P. 290
Pooja 87 98 76
Teena 67 87 89
Rohit 98 45 98
Insert two new columns before ‘Total Marks’ column and name them as Science and Computer
Science. Add suitable data in the cells.
Calculate total marks and percentage obtained by each student.
Insert two rows and enter data in them.
Change the percentage so that it displays two places of decimal.
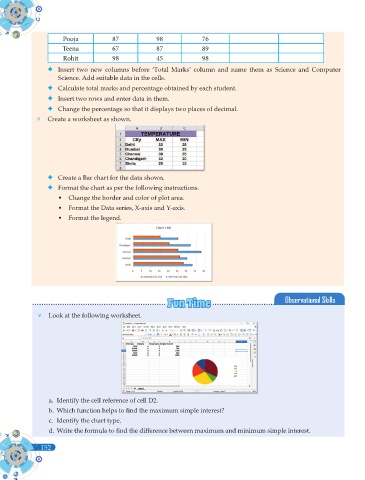
v Create a worksheet as shown.
Create a Bar chart for the data shown.
Format the chart as per the following instructions.
• Change the border and color of plot area.
• Format the Data series, X-axis and Y-axis.
• Format the legend.
Observational Skills
Fun Time Observational Skills
Fun Time
v Look at the following worksheet.
a. Identify the cell reference of cell D2.
b. Which function helps to fi nd the maximum simple interest?
c. Identify the chart type.
d. Write the formula to fi nd the difference between maximum and minimum simple interest.
152
152