
Page 158 - Ai Book - 10
P. 158
u Cameras: Cameras are used to collect data in the form of images. CCTV, surveillance cameras are sources of
visual data the can be acquired from various places.
u Observation: Using the observation technique, data can be analysed and used for testing the model.
u Application Program Interface (APIs): APIs are a set of functions and procedures that allow one application
to connect to another. In this way data can be collected from social media services for analysis.
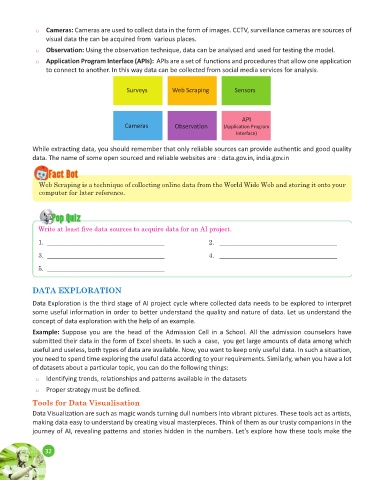
Surveys Web Scraping Sensors
API
Cameras Observation (Application Program
Interface)
While extracting data, you should remember that only reliable sources can provide authentic and good quality
data. The name of some open sourced and reliable websites are : data.gov.in, india.gov.in
Web Scraping is a technique of collecting online data from the World Wide Web and storing it onto your
computer for later reference.
Pop Quiz Quiz
Pop
Write at least five data sources to acquire data for an AI project.
1. ____________________________________ 2. ____________________________________
3. ____________________________________ 4. ____________________________________
5. ____________________________________
DATA EXPLORATION
Data Exploration is the third stage of AI project cycle where collected data needs to be explored to interpret
some useful information in order to better understand the quality and nature of data. Let us understand the
concept of data exploration with the help of an example.
Example: Suppose you are the head of the Admission Cell in a School. All the admission counselors have
submitted their data in the form of Excel sheets. In such a case, you get large amounts of data among which
useful and useless, both types of data are available. Now, you want to keep only useful data. In such a situation,
you need to spend time exploring the useful data according to your requirements. Similarly, when you have a lot
of datasets about a particular topic, you can do the following things:
u Identifying trends, relationships and patterns available in the datasets
u Proper strategy must be defined.
Tools for Data Visualisation
Data Visualization are such as magic wands turning dull numbers into vibrant pictures. These tools act as artists,
making data easy to understand by creating visual masterpieces. Think of them as our trusty companions in the
journey of AI, revealing patterns and stories hidden in the numbers. Let’s explore how these tools make the
32
32