
Page 8 - AI Arena - 9
P. 8
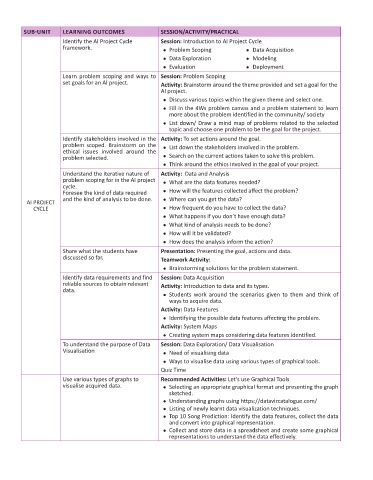
SUB-UNIT     LEARNING OUTCOMES                SESSION/ACTIVITY/PRACTICAL
                      Identify the AI Project Cycle    Session: Introduction to AI Project Cycle
                      framework.                         l  Problem Scoping         l  Data Acquisition
                                                         l  Data Exploration        l  Modeling
                                                         l  Evaluation              l  Deployment
                      Learn problem scoping and ways to  Session: Problem Scoping
                      set goals for an AI project.     Activity: Brainstorm around the theme provided and set a goal for the
                                                       AI project.
                                                         l  Discuss various topics within the given theme and select one.
                                                         l  Fill in the 4Ws problem canvas and a problem statement to learn
                                                          more about the problem identified in the community/ society
                                                         l  List down/ Draw a mind map of problems related to the selected
                                                          topic and choose one problem to be the goal for the project.
                      Identify stakeholders involved in the   Activity: To set actions around the goal.
                      problem scoped.  Brainstorm  on the     l  List down the stakeholders involved in the problem.
                      ethical issues  involved around  the
                      problem selected.                  l  Search on the current actions taken to solve this problem.
                                                         l  Think around the ethics involved in the goal of your project.
                      Understand the iterative nature of   Activity:  Data and Analysis
                      problem scoping for in the AI project     l  What are the data features needed?
                      cycle.
                      Foresee the kind of data required     l  How will the features collected affect the problem?
          AI PROJECT   and the kind of analysis to be done.     l  Where can you get the data?
            CYCLE                                        l  How frequent do you have to collect the data?
                                                         l  What happens if you don’t have enough data?
                                                         l  What kind of analysis needs to be done?
                                                         l  How will it be validated?
                                                         l  How does the analysis inform the action?
                      Share what the students have     Presentation: Presenting the goal, actions and data.
                      discussed so far.                Teamwork Activity:

                                                         l  Brainstorming solutions for the problem statement.
                      Identify data requirements and find   Session: Data Acquisition
                      reliable sources to obtain relevant   Activity: Introduction to data and its types.
                      data.
                                                         l  Students  work  around  the  scenarios  given  to  them  and  think  of
                                                          ways to acquire data.
                                                       Activity: Data Features
                                                         l  Identifying the possible data features affecting the problem.
                                                       Activity: System Maps
                                                         l  Creating system maps considering data features identified.
                      To understand the purpose of Data   Session: Data Exploration/ Data Visualisation
                      Visualisation                      l  Need of visualising data
                                                         l  Ways to visualise data using various types of graphical tools.
                                                       Quiz Time
                      Use various types of graphs to   Recommended Activities: Let’s use Graphical Tools
                      visualise acquired data.           l  Selecting an appropriate graphical format and presenting the graph
                                                          sketched.
                                                         l  Understanding graphs using https://datavizcatalogue.com/
                                                         l  Listing of newly learnt data visualization techniques.
                                                         l  Top 10 Song Prediction: Identify the data features, collect the data
                                                          and convert into graphical representation.
                                                         l  Collect and store data in a spreadsheet and create some graphical
                                                          representations to understand the data effectively.