
Page 149 - Revised Maths Wisdom Class - 1
P. 149
Data Handling 147
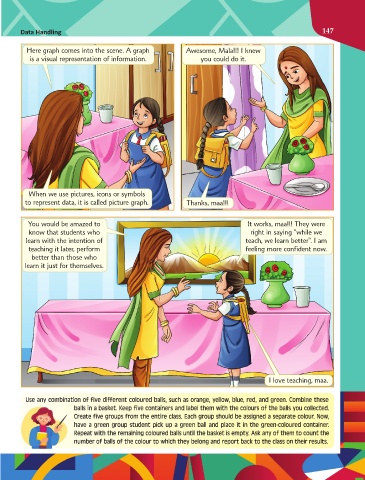
Here graph comes into the scene. A graph Awesome, Mala!!! I knew
is a visual representation of information. you could do it.
When we use pictures, icons or symbols
to represent data, it is called picture graph. Thanks, maa!!!
You would be amazed to It works, maa!!! They were
know that students who right in saying "while we
learn with the intention of teach, we learn better". I am
teaching it later, perform feeling more confident now.
better than those who
learn it just for themselves.
I love teaching, maa.
Use any combination of five different coloured balls, such as orange, yellow, blue, red, and green. Combine these
balls in a basket. Keep five containers and label them with the colours of the balls you collected.
Create five groups from the entire class. Each group should be assigned a separate colour. Now,
have a green group student pick up a green ball and place it in the green-coloured container.
Repeat with the remaining coloured balls until the basket is empty. Ask any of them to count the
number of balls of the colour to which they belong and report back to the class on their results.