
Page 160 - Ai Book - 10
P. 160
Suitable for which type of data It is suitable to compare primary
data with respect to other data and
displays it in the context of qualitative
ranges.
Data Visualization Technique 2
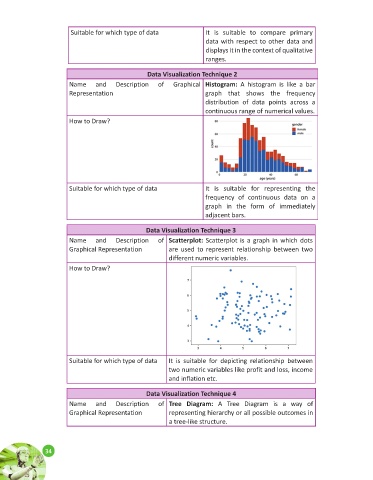
Name and Description of Graphical Histogram: A histogram is like a bar
Representation graph that shows the frequency
distribution of data points across a
continuous range of numerical values.
How to Draw?
Suitable for which type of data It is suitable for representing the
frequency of continuous data on a
graph in the form of immediately
adjacent bars.
Data Visualization Technique 3
Name and Description of Scatterplot: Scatterplot is a graph in which dots
Graphical Representation are used to represent relationship between two
different numeric variables.
How to Draw?
Suitable for which type of data It is suitable for depicting relationship between
two numeric variables like profit and loss, income
and inflation etc.
Data Visualization Technique 4
Name and Description of Tree Diagram: A Tree Diagram is a way of
Graphical Representation representing hierarchy or all possible outcomes in
a tree-like structure.
34
34